Softmax 함수와 MNIST 이미지 분류 

이번 포스팅에서는 Softmax 함수를 이용한 다중분류(Multi-Class Classification)의 원리와, 실제 MNIST 손글씨 데이터셋을 사용한 이미지 분류 실습을 함께 다룹니다.


Ⅰ. Softmax 함수 개요

Softmax 함수는 여러 클래스 중 하나를 예측해야 하는 다중분류 문제에서 사용되는 활성함수입니다. 입력값을 0~1 사이의 확률로 변환하며, 각 클래스의 확률 합이 항상 1이 되도록 정규화합니다.

Softmax 공식

Softmax(zᵢ) = e^(zᵢ) / Σ e^(zⱼ)
  • zᵢ : i번째 클래스의 로짓(logit, 선형결합 결과)
  • Σ e^(zⱼ) : 모든 클래스의 지수 합
  • 결과 : 각 클래스에 대한 확률 (0 ≤ p ≤ 1, Σp=1)

요약

본 글은 4개의 실습 파일을 통해 Softmax 기반 다중분류의 기본 개념부터 MNIST(손글씨)·Fashion-MNIST(의류) 데이터셋 분류까지의 흐름을 정리합니다. 각 파일의 역할, 전처리(평탄화/정규화), 모델 설계(은닉층/활성화/손실), 학습·평가·시각화를 간단 주석과 함께 살펴봅니다.

  • Ex01_softmax.py: 난수 데이터로 Softmax 다중분류 최소 예제
  • Ex02_mnist_이미지분류.py: MNIST 구조 확인 및 샘플 시각화
  • Ex03_mnist.py: MLP로 MNIST 분류(평탄화+정규화+원-핫)
  • Ex04_mnist.py: Fashion-MNIST 분류(128×2 은닉층) & 시각화
Tip: 분류 문제는 출력층 softmax + 손실함수 categorical_crossentropy 조합(원-핫 라벨 기준)이 정석입니다.

Ⅱ. Ex01 – Softmax 다중분류 기본 예제

난수로 생성한 (샘플 10 × 특성 4) 입력을 3개 클래스 중 하나로 분류하는 최소 예제입니다. 전처리와 API 흐름(모델 구성→컴파일→학습)을 익히기에 적합합니다.
핵심 포인트
  • 라벨을 to_categorical로 원-핫 인코딩 → categorical_crossentropy 사용
  • 출력층 Dense(3, activation='softmax') → 클래스 확률 합=1
  • validation_split=0.3으로 검증셋 자동 분리
import numpy as np
from keras import Sequential
from keras.src.layers import Dense, Input
from tensorflow.python.keras.utils.np_utils import to_categorical

# 1️⃣ 입력 데이터 (랜덤 생성)
x_data = np.random.random((10, 4))              # 10개 샘플, 4개의 피처
y_labels = np.random.randint(0,3,size=(10,))    # 0~2 클래스 중 랜덤 레이블
print(f'x_data: {x_data}')
print(f'y_labels: {y_labels}')

# 2️⃣ 원-핫 인코딩 (to_categorical)
# → 클래스 0,1,2를 [1,0,0], [0,1,0], [0,0,1] 형태로 변환
y_data = to_categorical(y_labels, num_classes=3)
print(f'y_data: {y_data}')
print()

# 3️⃣ 모델 구성: 입력(4) → 은닉(30, ReLU) → 출력(3, Softmax)
model = Sequential([
    Dense(30, activation='relu', input_shape=(4,)),
    Dense(3, activation='softmax')
])

# 4️⃣ 모델 설정 및 학습
# 손실함수: categorical_crossentropy (다중분류용)
model.compile(optimizer='adam', loss='categorical_crossentropy', metrics=['accuracy'])
model.fit(x_data, y_data, epochs=10, validation_split=0.3, verbose=2)

# accuracy : 훈련 정확도 / val_accuracy : 검증 정확도

Ⅲ. MNIST 데이터셋 소개

MNIST는 0~9까지의 손글씨 숫자 이미지를 담은 대표적인 머신러닝 데이터셋입니다. 각 이미지는 28×28 픽셀의 흑백 이미지로, 총 70,000개(훈련 60,000 / 테스트 10,000)로 구성됩니다.


Ⅳ. Ex02 – MNIST 이미지 분류(EDA)

MNIST(28×28) 데이터셋을 불러 구조를 확인하고, 샘플 이미지를 라벨과 함께 시각화합니다(학습 X, 탐색/EDA 목적).
from keras.src.datasets import mnist
from matplotlib import pyplot as plt

# 1️⃣ 데이터 로드
(x_train, y_train), (x_test, y_test) = mnist.load_data()

print(x_train.shape)  # (60000, 28, 28)
print(y_train.shape)  # (60000,)
print(x_test.shape)   # (10000, 28, 28)
print(y_test.shape)   # (10000,)

print(x_train[0], y_train[0])  # 첫 번째 이미지와 정답 출력

# 2️⃣ 이미지 시각화(2×3 그리드)
nrow, ncol = 2, 3
fig, axes = plt.subplots(nrow, ncol, figsize=[10, 6])

for idx in range(nrow * ncol):
    ax = axes[idx // ncol, idx % ncol]
    ax.imshow(x_train[idx], cmap='gray')
    ax.axis('off')
    ax.set_title(f'label: {y_train[idx]}')

plt.show()

설명

  • mnist.load_data(): 자동으로 훈련/테스트 분리
  • x_train: 이미지 (28×28), y_train: 라벨(0~9)
  • 간단한 시각화로 데이터 감 잡기

Ⅴ. Softmax와 MNIST의 관계

  • MNIST는 10개 클래스(0~9) → 출력 뉴런 수=10
  • Softmax는 각 숫자 클래스 확률을 계산 → 가장 큰 확률의 클래스를 예측
  • 예: [0.01, 0.02, 0.93, …] → “2” 예측

Ⅵ. 추가 구현 아이디어(간단 MLP)

from keras import Sequential
from keras.src.layers import Dense, Flatten
from tensorflow.python.keras.utils.np_utils import to_categorical

# 1️⃣ 전처리(정규화/원-핫)
x_train = x_train / 255.0  # 0~255 → 0~1
x_test  = x_test  / 255.0
y_train = to_categorical(y_train, 10)
y_test  = to_categorical(y_test, 10)

# 2️⃣ 모델
model = Sequential([
    Flatten(input_shape=(28,28)),   # 2D → 1D
    Dense(128, activation='relu'),
    Dense(10,  activation='softmax')
])

# 3️⃣ 학습/평가
model.compile(optimizer='adam', loss='categorical_crossentropy', metrics=['accuracy'])
model.fit(x_train, y_train, epochs=5, batch_size=32, validation_split=0.1)
test_loss, test_acc = model.evaluate(x_test, y_test)
print(f"테스트 정확도: {test_acc:.4f}")

Ex03_mnist.py — MLP로 MNIST 다중분류

Dense 기반 MLP. 평탄화(28×28→784), 정규화, 원-핫 전처리와 학습/평가/예측 포함.
핵심 포인트
  • input_shape=(784,) 평탄화 벡터 입력
  • 은닉 512(ReLU) → 출력 10(Softmax)
  • validation_split=0.2로 검증
import numpy as np
from keras import Sequential
from keras.src.datasets import mnist
from keras.src.layers import Dense
from keras.src.utils import to_categorical
from matplotlib import pyplot as plt

# 1) 데이터 적재
(x_train, y_train), (x_test, y_test) = mnist.load_data()

# 2) 입력 차원 계산(28*28=784)
x_column = x_train.shape[1] * x_train.shape[2]
print('x_column:', x_column)

# 3) 평탄화 + 정규화
x_train = x_train.reshape(x_train.shape[0], x_column).astype('float32')/255.0
x_test  = x_test.reshape(x_test.shape[0],  x_column).astype('float32')/255.0

# 4) 원-핫 라벨
CLASSES = 10
y_train = to_categorical(y_train, num_classes=CLASSES)
y_test  = to_categorical(y_test,  num_classes=CLASSES)

# 5) 모델
model = Sequential()
model.add(Dense(units=512, activation="relu", input_shape=(x_column,)))
model.add(Dense(units=CLASSES, activation="softmax"))

# 6) 컴파일 & 학습
model.compile(loss="categorical_crossentropy", optimizer="rmsprop", metrics=["accuracy"])
model.fit(x_train, y_train, epochs=10, batch_size=64, validation_split=0.2, verbose=1)

# 7) 평가 & 예측
score = model.evaluate(x_test, y_test)
print(f'score : {score}')  # [loss, acc]

prediction = model.predict(x_test)
predict_class = np.argmax(prediction[0])
print(f'prediction class : {predict_class}')

Ex04_mnist.py — Fashion-MNIST 분류 & 시각화

Fashion-MNIST(의류 10종) 분류. 두 개 은닉층(128·128)과 Softmax 출력층 사용, 4×4 그리드 시각화 포함.
핵심 포인트 & 주의
  • 전처리: 평탄화 + 정규화(0~1)
  • class_names로 시각화 라벨 가독성
  • 주의: np.argmax(prediction)은 전체 배열 기준 → 개별 샘플은 np.argmax(prediction[i]) 사용
import numpy as np
from keras import Sequential
from keras.src.datasets import fashion_mnist
from keras.src.layers import Dense
from keras.src.utils import to_categorical
from matplotlib import pyplot as plt

# 1) 데이터 적재(Fashion-MNIST)
(x_train, y_train), (x_test, y_test) = fashion_mnist.load_data()
print(x_train.shape, y_train.shape, x_test.shape, y_test.shape)

# 2) 평탄화 + 정규화
x_column = x_train.shape[1] * x_train.shape[2]
x_train = x_train.reshape(x_train.shape[0], x_column).astype('float32')/255.0
x_test  = x_test.reshape(x_test.shape[0],  x_column).astype('float32')/255.0

# 3) 클래스 라벨
class_names = ['T-shirt/top', 'Trouser', 'Pullover', 'Dress', 'Coat',
               'Sandal', 'Shirt', 'Sneaker', 'Bag', 'Ankle boot']

# 4) 원-핫 라벨
CLASSES = 10
y_train = to_categorical(y_train, num_classes=CLASSES)
y_test  = to_categorical(y_test,  num_classes=CLASSES)

# 5) 모델: 128-128 ReLU → 10 Softmax
model = Sequential()
model.add(Dense(units=128, activation='relu', input_shape=(x_column,)))
model.add(Dense(units=128, activation='relu'))
model.add(Dense(units=CLASSES, activation='softmax'))

# 6) 컴파일 & 학습
model.compile(loss='categorical_crossentropy', optimizer='adam', metrics=['accuracy'])
model.fit(x_train, y_train, batch_size=10, epochs=10, validation_data=(x_test, y_test))

# 7) 예측 & 평가
prediction = model.predict(x_test)
score = model.evaluate(x_test, y_test)
print(f'손실률 : {score[0]}, 정확도 {score[1]}')

# (권장) 개별 샘플의 argmax
print('예측')
print('y_test', np.argmax(y_test[0]))
print('y_pred', np.argmax(prediction[0]))

# 8) 4x4 그리드 시각화
nrow, ncol = 4, 4
fig, axes = plt.subplots(nrow, ncol, figsize=[10, 6])
for idx in range(nrow * ncol):
    ax = axes[idx//ncol, idx%ncol]
    ax.imshow(x_train[idx].reshape(28,28))
    ax.axis('off')
    ax.set_title(f'label: {class_names[np.argmax(y_train[idx])]}')
plt.show()

Ⅶ. 요약

개념 역할 특징
Softmax 다중분류 확률 계산 출력 합=1, 각 클래스 확률
MNIST 데이터 0~9 손글씨 이미지 28×28 픽셀 흑백
Flatten 2D→1D 변환 Dense 입력에 사용
categorical_crossentropy 다중분류 손실 Softmax와 함께 사용

Ⅷ. 결론

Softmax 함수는 다중분류 모델의 핵심 구성요소로, 모든 클래스의 예측 결과를 확률의 형태로 표현하게 합니다.

MNIST 예제처럼 출력층 뉴런 수를 클래스 수(10개)에 맞추고 Softmax를 적용하면, 모델은 각 숫자(0~9)에 대한 확률을 계산해 가장 높은 확률의 클래스를 예측할 수 있습니다.

실행 메모

  • 환경: TensorFlow/Keras, matplotlib 필요
  • 전처리 체크리스트: reshapeastype('float32')/255.0to_categorical
  • 예측 인덱스: 개별 샘플은 np.argmax(prediction[i]) 형태로 확인

활성함수(Activation Function)와 로지스틱 회귀(Logistic Regression),

인공신경망(ANN) 개념 정리 시각화 확장


Ⅰ. 활성함수(Activation Function)

활성함수(Activation Function)는 인공신경망의 각 노드(뉴런)가 입력값을 받아 출력으로 보낼 때 적용하는 비선형 함수입니다. 즉, 단순한 선형 모델을 넘어 비선형 패턴을 학습할 수 있게 해주는 핵심 요소입니다.


1. 대표적인 활성함수

  • Sigmoid : 입력값을 0~1 사이로 매핑 (이진분류에 주로 사용)
  • ReLU (Rectified Linear Unit) : 0 이하 → 0, 0 이상 → 그대로 출력 (은닉층에서 주로 사용)
  • Tanh (Hyperbolic Tangent) : -1~1 사이로 매핑 (데이터 중심화를 돕는 함수)

import numpy as np
import matplotlib.pyplot as plt

# 한글 폰트 깨짐 방지
plt.rcParams['font.family'] = 'Malgun Gothic'
plt.rcParams['axes.unicode_minus'] = False

# 1️⃣ 입력값 생성 (-10~10)
x = np.linspace(-10, 10, 100)

# 2️⃣ 각 활성함수 정의
sigmoid = 1 / (1 + np.exp(-x))
relu = np.maximum(0, x)
tanh = np.tanh(x)

# 3️⃣ 시각화
plt.figure(figsize=(12, 6))

plt.subplot(1, 3, 1)
plt.plot(x, sigmoid, color='red')
plt.title('Sigmoid 함수')
plt.grid(True)

plt.subplot(1, 3, 2)
plt.plot(x, relu, color='blue')
plt.title('ReLU 함수')
plt.grid(True)

plt.subplot(1, 3, 3)
plt.plot(x, tanh, color='green')
plt.title('Tanh 함수')
plt.grid(True)

plt.suptitle('활성함수 비교 (Sigmoid, ReLU, Tanh)')
plt.show()

그래프 해석

  • Sigmoid: 출력이 0~1 사이, 확률 해석에 적합
  • ReLU: 음수 입력 0으로 억제 → 기울기 소실 문제 완화
  • Tanh: 출력이 -1~1로 중심화되어 학습 안정성 개선

Ⅱ. 로지스틱 회귀(Logistic Regression)

로지스틱 회귀(Logistic Regression)는 이름은 “회귀”지만, 실제로는 이진분류(Binary Classification) 모델입니다. 입력값의 선형결합을 시그모이드 함수를 통해 확률로 변환하여 결과를 0(음성) 또는 1(양성)으로 분류합니다.


import numpy as np
from sklearn.linear_model import LogisticRegression
from sklearn.metrics import accuracy_score
from sklearn.model_selection import train_test_split

# 1️⃣ CSV 데이터 로드
dataIn = "../00_dataIn/"
filename = dataIn + "surgeryTest.csv"
data = np.loadtxt(filename, delimiter=",", skiprows=1)

# 2️⃣ 입력(X), 출력(y) 분리
x = data[:, :-1]
y = data[:, -1]

# 3️⃣ 학습/테스트 데이터 분리
x_train, x_test, y_train, y_test = train_test_split(
    x, y, test_size=0.2, stratify=y, random_state=42
)

# 4️⃣ 모델 생성 및 학습
model = LogisticRegression()
model.fit(x_train, y_train)

# 5️⃣ 예측 및 정확도 확인
predict_proba = model.predict_proba(x_test)
y_pred = model.predict(x_test)
acc = accuracy_score(y_test, y_pred)

print(f'예측확률:\n{predict_proba[:5]}')
print(f'예측결과: {y_pred[:10]}')
print(f'정확도(Accuracy): {acc:.3f}')

핵심 포인트

  • 시그모이드 함수를 통해 0~1 확률값으로 출력
  • 확률 ≥ 0.5 → 1(양성), 미만 → 0(음성)
  • Logistic Regression은 인공신경망의 기본 구조

Ⅲ. 로지스틱 회귀 시그모이드 곡선 시각화


import numpy as np
import matplotlib.pyplot as plt

# 1️⃣ 입력값 (-10~10)
x = np.linspace(-10, 10, 100)
# 2️⃣ 시그모이드 함수
y = 1 / (1 + np.exp(-x))

# 3️⃣ 시각화
plt.figure(figsize=(8,5))
plt.plot(x, y, color='red', linewidth=2)
plt.title('로지스틱 회귀의 시그모이드 곡선')
plt.xlabel('입력값 (선형결합 결과)')
plt.ylabel('출력 확률 P(y=1)')
plt.grid(True)
plt.axhline(0.5, color='gray', linestyle='--')  # 결정 경계선
plt.axvline(0, color='gray', linestyle='--')
plt.text(0.5, 0.53, "결정 경계 (P=0.5)", fontsize=9)
plt.show()

그래프 해석

  • x=0일 때 P(y=1)=0.5 → 분류 경계
  • 왼쪽은 0에 가까움(음성), 오른쪽은 1에 가까움(양성)
  • 시그모이드의 “S자” 형태가 분류 경계를 자연스럽게 형성

Ⅳ. 인공신경망(ANN) 실습


import numpy as np
from keras import Sequential, Input
from keras.src.layers import Dense
from sklearn.model_selection import train_test_split

# 1️⃣ 데이터 불러오기
data = np.loadtxt("../00_dataIn/surgeryTest.csv", delimiter=",", skiprows=1)
x = data[:, :-1]
y = data[:, -1]

# 2️⃣ 학습/테스트 분리
x_train, x_test, y_train, y_test = train_test_split(
    x, y, test_size=0.2, stratify=y, random_state=42
)

# 3️⃣ 모델 구성 (Sequential)
model = Sequential([
    Input(shape=(x.shape[1],)),        # 입력층
    Dense(30, activation="relu"),      # 은닉층 (ReLU)
    Dense(1, activation="sigmoid")     # 출력층 (Sigmoid)
])

# 4️⃣ 학습 설정 및 실행
model.compile(loss="binary_crossentropy", optimizer="adam", metrics=["accuracy"])
fit_hist = model.fit(x_train, y_train, epochs=30, batch_size=10, verbose=1)
print(fit_hist.history.keys())

# 5️⃣ 예측
prediction = model.predict(x_test)
pred_label = (prediction > 0.5).astype(int)
print("예측 확률:", prediction[:5])
print("이진 분류 결과:", pred_label[:5])

핵심 포인트

  • 은닉층: ReLU → 비선형성 부여
  • 출력층: Sigmoid → 확률로 변환
  • 손실함수: binary_crossentropy
  • 최적화기: Adam (RMSProp + Momentum 조합)

Ⅴ. 활성함수 비교 요약표

함수 공식 출력 범위 특징
Sigmoid 1 / (1 + e^-x) 0 ~ 1 확률 출력, 이진분류 출력층
ReLU max(0, x) 0 ~ ∞ 기울기 소실 완화, 은닉층 표준
Tanh (e^x - e^-x) / (e^x + e^-x) -1 ~ 1 데이터 중심화, 은닉층 대체 가능

Ⅵ. 결론

활성함수는 인공신경망의 핵심 요소로, 모델이 단순한 선형 관계를 넘어 복잡한 비선형 패턴을 학습할 수 있게 해줍니다.

ReLU는 은닉층에서, Sigmoid는 출력층에서 주로 사용되며 로지스틱 회귀는 시그모이드 함수 기반의 확률 분류 원리를 단순화한 모델입니다.

결국 Sigmoid–ReLU–Softmax는 딥러닝 신경망의 근간을 이루는 핵심 활성함수 3대장입니다.

나이브 베이즈(Naive Bayes) 

나이브 베이즈(Naive Bayes)는 확률 기반의 지도학습 분류 알고리즘입니다. 각 특징(feature)이 서로 독립(naive)이라고 가정하고, 베이즈 정리(Bayes' Theorem)를 이용해 주어진 데이터가 특정 클래스에 속할 확률을 계산합니다.


Ⅰ. 이론 개요


1. 베이즈 정리 (Bayes’ Theorem)

P(A|B) = [ P(B|A) * P(A) ] / P(B)

→ 사건 B가 일어났을 때 A가 일어날 확률을 계산


2. 나이브 베이즈의 핵심 아이디어

  • 입력 데이터의 각 특성(feature)은 서로 독립적이라 가정
  • 각 클래스별 사전확률(P(A))과 조건부확률(P(B|A))을 계산
  • 가장 확률이 높은 클래스로 분류

3. 종류

  • MultinomialNB: 단어 등장 횟수 기반 (텍스트 데이터)
  • GaussianNB: 연속형 실수 데이터 (정규분포 가정)
  • BernoulliNB: 0/1 형태 데이터 (이진 피처)

Ⅱ. Ex01 – 기본 나이브 베이즈 예제


from sklearn.feature_extraction.text import CountVectorizer
from sklearn.naive_bayes import MultinomialNB

# 1️⃣ 데이터 준비
docs = [
    "banana apple apple q ??",   # 과일 관련
    "banana grape w q@",          # 과일 관련
    "grape apple banana 123",     # 과일 관련
    "dog cat",                    # 동물 관련
    "dog apple",                  # 애매한 경우
    "cat banana"                  # 애매한 경우
]
labels = [0, 0, 0, 1, 1, 1]  # 0=과일, 1=동물

# 2️⃣ 문장 → 벡터화
vectorizer = CountVectorizer()
x = vectorizer.fit_transform(docs)

print("단어 사전:", vectorizer.vocabulary_)
print("x.shape:", x.shape)
print(x.toarray())  # 희소행렬을 배열로 확인

# 3️⃣ 모델 학습
model = MultinomialNB()
model.fit(x, labels)

# 4️⃣ 새 문장 예측
new_docs = ["apple banana", "dog grape"]
new_x = vectorizer.transform(new_docs)
pred = model.predict(new_x)

print("예측 결과:", pred)  # [0, 1] → 첫 문장 과일, 두 번째 동물

해설

  • 단어 출현 횟수를 CountVectorizer로 벡터화
  • MultinomialNB로 학습하여 확률 기반 분류 수행
  • 텍스트 데이터에서 자주 등장하는 단어 패턴을 학습

Ⅲ. Ex02 – 파일에서 텍스트 벡터화


from sklearn.feature_extraction.text import CountVectorizer
from sklearn.naive_bayes import MultinomialNB

# 1️⃣ 텍스트 파일 읽기
words = []
with open('../00_dataIn/text01.txt', 'r', encoding='utf8') as f:
    for line in f:
        words.append(line.strip())  # 개행 문자 제거 후 리스트 추가

# 2️⃣ 단어 벡터화
# min_df=2 → 최소 2번 이상 등장한 단어만 포함
# stop_words → 특정 단어 제거
vectorizer = CountVectorizer(min_df=2, stop_words=['세일'])
x = vectorizer.fit_transform(words)

# 3️⃣ 단어 사전 및 결과 확인
print("단어 사전:", vectorizer.vocabulary_)
print("단어 목록:", vectorizer.get_feature_names_out())
print(x.toarray())

핵심 포인트

  • 텍스트 파일에서 직접 문장 불러와 벡터화
  • min_df: 특정 단어의 최소 등장 빈도 제한
  • stop_words: 의미 없는 단어(불용어) 제거

Ⅳ. Ex03 – 이메일 스팸 분류 (한국어 형태소 분석)


import pandas as pd
from sklearn.feature_extraction.text import CountVectorizer
from konlpy.tag import Okt
from sklearn.model_selection import train_test_split
from sklearn.naive_bayes import MultinomialNB

# 1️⃣ 형태소 분석기(Okt) 사용
okt = Okt()
print(okt.morphs("오늘 일정 확인"))

# 2️⃣ 이메일 데이터 불러오기
df = pd.read_csv('../00_dataIn/mailList.csv')  # 제목, 레이블(ham/spam)
emails = [tuple(row) for row in df.itertuples(index=False)]

# 3️⃣ 형태소 분석 및 전처리 함수
def tokenize(text):
    """문장을 형태소 단위로 분리하고 공백으로 연결"""
    return ' '.join(okt.morphs(text))

# 4️⃣ 형태소 단위로 변환
emails_tokenized = [(tokenize(subject), label) for subject, label in emails]
x, y = zip(*emails_tokenized)

# 5️⃣ 학습 / 테스트 데이터 분리 (8:2)
x_train_text, x_test_text, y_train, y_test = train_test_split(
    x, y, test_size=0.2, random_state=42
)

# 6️⃣ CountVectorizer로 벡터화
vectorizer = CountVectorizer()
x_train = vectorizer.fit_transform(x_train_text)
x_test = vectorizer.transform(x_test_text)

# 7️⃣ 모델 학습 및 예측
model = MultinomialNB()
model.fit(x_train, y_train)
y_pred = model.predict(x_test)

# 8️⃣ 새 이메일 예측
new_data = [line.strip() for line in open('../00_dataIn/checkedMail.csv', encoding='utf-8')]
for mail in new_data:
    mail_tokenized = tokenize(mail)
    mail_vec = vectorizer.transform([mail_tokenized])
    pred = model.predict(mail_vec)
    print(f"{mail} → 예측 결과: {pred[0]}")

설명

  • 한글 문장을 형태소 단위로 분리 후 벡터화
  • MultinomialNB를 이용해 스팸/정상 메일 분류
  • 새로운 이메일 입력 시 자동 예측 가능

Ⅴ. Ex04 – 뉴스 기사 분류 (정치/경제/스포츠)


import pandas as pd
from sklearn.feature_extraction.text import CountVectorizer
from konlpy.tag import Okt
from sklearn.model_selection import train_test_split
from sklearn.naive_bayes import MultinomialNB
from sklearn import metrics
from sklearn.metrics import classification_report

# 1️⃣ 데이터 준비
titles = [
    "대통령 신년 기자회견 열려", "야당 대표, 정부 정책 비판", "정치권, 총선 준비 돌입",
    "한국, 월드컵 본선 진출 확정", "손흥민 멀티골로 팀 승리 견인", "주식 시장, 3일 연속 하락"
]
labels = ["politics", "politics", "politics", "sports", "sports", "economy"]

# 2️⃣ 형태소 분석 및 토큰화
okt = Okt()
def tokenize(text):
    tokens = okt.pos(text)
    return ' '.join([word for word, pos in tokens if pos in ['Noun','Verb','Adjective']])

tokenized_titles = [tokenize(t) for t in titles]

# 3️⃣ 벡터화
vectorizer = CountVectorizer()
x = vectorizer.fit_transform(tokenized_titles)
y = labels

# 4️⃣ 데이터 분할
x_train, x_test, y_train, y_test = train_test_split(x, y, test_size=0.3, random_state=42)

# 5️⃣ 나이브 베이즈 모델 학습
model = MultinomialNB()
model.fit(x_train, y_train)

# 6️⃣ 예측 및 평가
y_pred = model.predict(x_test)
print(metrics.confusion_matrix(y_test, y_pred))
print(classification_report(y_test, y_pred))
print("정확도:", metrics.accuracy_score(y_test, y_pred))

설명

  • 뉴스 제목을 형태소 단위로 분석 후 CountVectorizer로 벡터화
  • MultinomialNB로 정치/경제/스포츠 분류
  • 정확도, 혼동행렬, F1-score 등으로 평가

Ⅵ. 요약 정리

예제 주제 핵심 포인트
Ex01 기본 나이브 베이즈 단어 출현 빈도 기반 기본 구조 이해
Ex02 파일 텍스트 벡터화 CountVectorizer 파라미터 학습
Ex03 이메일 스팸 분류 형태소 분석(Okt) 기반 한글 처리
Ex04 뉴스 카테고리 분류 정치/경제/스포츠 다중 분류 및 평가

Ⅶ. 결론

나이브 베이즈는 단어 등장 확률을 기반으로 텍스트를 분류하는 가장 직관적이고 효율적인 모델입니다. 특히 문서 분류, 스팸 탐지, 뉴스 카테고리 분류 등 자연어 처리(NLP) 분야에서 강력한 기본 baseline 모델로 사용됩니다.

단순하지만 빠르고, 적은 데이터로도 높은 성능을 낼 수 있어 텍스트 분류 입문자에게 가장 추천되는 알고리즘입니다.

엔트로피(Entropy)와 정보이득(Information Gain) 개념 정리

엔트로피(Entropy)는 데이터의 불확실성(Uncertainty) 또는 무질서도(Disorder)를 수치로 표현한 개념입니다. 정보이론(Information Theory)에서 시작된 개념으로, 결정트리(Decision Tree) 알고리즘의 분할 기준(Information Gain)을 계산할 때 핵심적으로 사용됩니다.


Ⅰ. 엔트로피 개념

1. 엔트로피란?

어떤 사건이 얼마나 불확실한지를 나타내는 값입니다.

  • 모든 데이터가 한 클래스에 속하면 → 불확실성 0 (Entropy = 0)
  • 데이터가 균등하게 섞여 있으면 → 불확실성 최대 (Entropy = 1)

2. 엔트로피 공식

Entropy = - Σ (pᵢ * log₂(pᵢ))

여기서 pᵢ는 각 클래스의 확률입니다.

3. 예시

  • 데이터가 [1, 0, 1, 0] → p(1)=0.5, p(0)=0.5 → Entropy = 1.0
  • 데이터가 [1, 1, 1, 1] → p(1)=1.0 → Entropy = 0.0

Ⅱ. Titanic 데이터로 보는 엔트로피 실습

이번 예제에서는 성별객실등급(class)에 따른 생존여부(survived)의 엔트로피를 계산하고, 그 결과를 시각화합니다.


from collections import Counter
import numpy as np
from matplotlib import pyplot as plt
import seaborn as sns
import pandas as pd

# 한글 폰트 설정
plt.rcParams['font.family'] = 'Malgun Gothic'
plt.rcParams['axes.unicode_minus'] = False

# 1. Titanic 데이터 불러오기
df = sns.load_dataset('titanic')
df.rename(columns={'sex':'gender'}, inplace=True)
df = df[['gender', 'survived', 'class']].dropna()

# 2. 엔트로피 계산 함수
def entropy_test(probabilities):
    return -np.sum(probabilities * np.log2(probabilities))

result = []

# 3. 성별(gender)과 객실등급(class)별 그룹화
for (gen, cls), group in df.groupby(['gender', 'class']):
    counts = Counter(group['survived'])             # 생존여부 빈도수
    total_count = sum(counts.values())
    ratios = {key: value / total_count for key, value in counts.items()}
    probabilities = list(ratios.values())           # 생존/사망 확률 리스트
    entropy = entropy_test(probabilities)           # 엔트로피 계산
    result.append({'성별': gen, '객실등급': cls, '엔트로피': entropy})

entropy_df = pd.DataFrame(result)
print(entropy_df)

# 4. 시각화
plt.figure(figsize=(8,5))
sns.barplot(data=entropy_df, x='객실등급', y='엔트로피', hue='성별')
plt.title('Titanic 생존여부의 엔트로피 (성별/객실등급별)')
plt.xlabel('객실등급')
plt.ylabel('엔트로피(bits)')
plt.legend(title='성별')
plt.show()

코드 설명

  • Counter(): 생존(1), 사망(0) 데이터 개수 집계
  • np.log2(): 로그 기반 2 (bit 단위 정보량 계산)
  • groupby(): 성별과 객실등급별로 그룹화
  • entropy_test(): 각 그룹별 생존 확률로 엔트로피 계산

결과 해석

  • 엔트로피가 낮을수록(0에 가까움) 생존여부가 명확함 → 예측 쉬움
  • 엔트로피가 높을수록(1에 가까움) 생존여부가 불확실함 → 예측 어려움

Ⅲ. 연령대별 엔트로피 계산

이번에는 연령대(age-group)로 그룹화하여 각 연령별 생존여부의 엔트로피를 계산합니다.


from collections import Counter
import pandas as pd
import numpy as np
import seaborn as sns

# Titanic 데이터 다시 불러오기
df = sns.load_dataset('titanic')
df = df[['age', 'embarked', 'survived']].dropna()

# 연령대를 구간으로 나누기
bins = [0, 10, 20, 30, 40, 50, 60, 80]
labels = ['0-9', '10-19', '20-29', '30-39', '40-49', '50-59', '60+']
df['age-group'] = pd.cut(df['age'], bins, labels=labels)

# 엔트로피 계산 함수 재사용
def entropy_test(probabilities):
    return -np.sum(probabilities * np.log2(probabilities))

result2 = []
for group, subset in df.groupby('age-group'):
    counts = Counter(subset['survived'])              # 생존/사망 수
    total_count = sum(counts.values())
    ratios = {key: value / total_count for key, value in counts.items()}
    probabilities = list(ratios.values())
    entropy = entropy_test(probabilities)
    result2.append({'연령대': group, '엔트로피': entropy})

result2_df = pd.DataFrame(result2)
print(result2_df)

코드 설명

  • pd.cut(): 연속형 변수(age)를 구간별 범주형으로 변환
  • 각 연령대의 생존 확률 분포를 이용해 엔트로피 계산
  • 엔트로피가 낮은 연령대일수록 생존율 차이가 뚜렷함

시각화 아이디어 (추가 가능)


import matplotlib.pyplot as plt
sns.barplot(data=result2_df, x='연령대', y='엔트로피', palette='coolwarm')
plt.title('연령대별 생존여부 엔트로피')
plt.xlabel('연령대')
plt.ylabel('엔트로피(bits)')
plt.show()

Ⅳ. 엔트로피 해석 요약

엔트로피 값 의미 예시
0 불확실성 없음 (한 클래스만 존재) 모두 생존 or 모두 사망
0.5 ~ 0.9 중간 정도의 불확실성 생존/사망 비율이 다소 불균형
1 최대 불확실성 (균등 분포) 생존 50%, 사망 50%

Ⅴ. 결론

엔트로피는 데이터의 순도(Purity)를 정량적으로 평가하는 지표입니다. 결정트리(Decision Tree)에서 분할 노드를 선택할 때, 엔트로피 감소량(정보이득, Information Gain)이 가장 큰 변수를 선택함으로써 최적의 분류 기준을 찾습니다.

즉, 엔트로피는 단순한 통계 지표를 넘어, 데이터의 불확실성 → 예측의 확실성으로 나아가기 위한 핵심 수학적 도구입니다.


Ⅵ. Information Gain (정보이득)

Information Gain (IG)은 데이터를 어떤 기준(feature)으로 나누었을 때, 불확실성(Entropy)이 얼마나 감소했는지를 측정하는 지표입니다. 결정트리 알고리즘은 Information Gain이 가장 높은 변수를 기준으로 데이터를 분할합니다.

1. 정보이득 공식

IG(S, A) = Entropy(S) − Σ (|Sᵥ| / |S|) × Entropy(Sᵥ)
  • S : 전체 데이터셋
  • A : 분할 기준이 되는 속성(feature)
  • Sᵥ : A의 특정 값으로 나눈 하위 그룹
  • |Sᵥ| / |S| : 각 그룹의 비율(가중치)

2. 의미

  • Information Gain이 클수록 → 불확실성이 크게 줄어듦 → 좋은 분할 기준
  • Information Gain이 작을수록 → 불확실성이 거의 변하지 않음 → 비효율적 기준


3. Titanic 데이터로 IG 계산하기


import numpy as np
import pandas as pd
from collections import Counter
import seaborn as sns

# Titanic 데이터 불러오기
df = sns.load_dataset('titanic')
df.rename(columns={'sex':'gender'}, inplace=True)
df = df[['gender', 'survived', 'class']].dropna()

# 엔트로피 계산 함수
def entropy(probabilities):
    return -np.sum(probabilities * np.log2(probabilities))

# 전체 엔트로피 계산
total_counts = Counter(df['survived'])
total_probs = np.array([v / sum(total_counts.values()) for v in total_counts.values()])
entropy_total = entropy(total_probs)

# 특정 feature 기준으로 Information Gain 계산
def information_gain(df, feature):
    weighted_entropy = 0
    for value, subset in df.groupby(feature):
        counts = Counter(subset['survived'])
        probs = np.array([v / sum(counts.values()) for v in counts.values()])
        subset_entropy = entropy(probs)
        weighted_entropy += (len(subset) / len(df)) * subset_entropy
    return entropy_total - weighted_entropy

# 성별, 객실등급별 IG 계산
ig_gender = information_gain(df, 'gender')
ig_class = information_gain(df, 'class')

print("전체 엔트로피 :", round(entropy_total, 4))
print("성별 기준 IG :", round(ig_gender, 4))
print("객실등급 기준 IG :", round(ig_class, 4))

예시 출력


전체 엔트로피 : 0.9587
성별 기준 IG : 0.2524
객실등급 기준 IG : 0.1835

결과 해석

  • Information Gain이 높은 성별(gender) 기준으로 데이터를 나누면 불확실성이 가장 많이 감소함.
  • 즉, gender가 Titanic 생존 예측에서 더 중요한 변수로 작용함.

4. IG 요약

개념 수식 의미
Entropy - Σ pᵢ log₂(pᵢ) 데이터의 불확실성(무질서도)
Information Gain Entropy(S) − Σ (|Sᵥ| / |S|) × Entropy(Sᵥ) 특정 속성(feature)으로 분할 시 불확실성 감소량

5. 결론

Information Gain은 “데이터를 얼마나 잘 나누는가”를 판단하는 지표입니다. 결정트리(Decision Tree)는 매 단계마다 Information Gain이 가장 큰 변수를 선택하여 엔트로피(불확실성)를 최대한 줄이는 방향으로 트리를 성장시킵니다.

즉, 엔트로피(Entropy)가 데이터의 혼잡도를 측정한다면, 정보이득(Information Gain)은 그 혼잡도를 얼마나 효과적으로 줄였는지를 수치로 표현하는 개념입니다.

K-최근접 이웃(K-Nearest Neighbors, KNN) 알고리즘 완벽 정리

KNN(K-Nearest Neighbors) 알고리즘은 거리(Distance) 기반으로 데이터를 분류(Classification)하거나 예측(Regression)하는 비모수 지도학습 모델입니다. 새로운 데이터가 주어졌을 때, 그 데이터와 가장 가까운 K개의 이웃 데이터를 찾아 다수결 또는 평균값으로 결과를 결정합니다.


Ⅰ. KNN 알고리즘 개요

1. 알고리즘 원리

새로운 데이터 포인트 x'가 주어지면, 다음 과정을 거칩니다.

  1. 모든 데이터와 거리를 계산
  2. 가장 가까운 K개 이웃 선택
  3. 이웃들의 다수결(분류) 또는 평균(회귀)으로 결과 예측

2. 거리 계산식 (Euclidean Distance)

d = √((x₂ - x₁)² + (y₂ - y₁)²)

→ 두 점 사이의 직선 거리로, 가까울수록 유사도가 높다고 판단합니다.

3. K 값에 따른 변화

  • K 작음 → 민감한 예측, 과적합 위험 ↑
  • K 큼 → 부드러운 경계, 일반화 ↑

4. 장단점

장점 단점
1. 구현이 매우 간단
2. 학습 과정이 빠름
3. 다양한 거리 기반 문제에 사용 가능
1. 데이터가 많으면 예측 시 느림
2. 이상치나 노이즈에 민감
3. 스케일링 필요

5. 적용 예시

  • 이메일 스팸 탐지
  • 신용카드 이상 거래 탐지
  • 이미지 분류(MNIST 등)
  • 추천 시스템 (유사도 기반)

Ⅱ. KNN 실습 예제 (Ex01~Ex05)

이 섹션에서는 단계별 KNN 실습 예제를 통해 알고리즘의 작동 원리를 시각적으로 이해합니다.


1. Ex01 – 과일 분류 (기초 예제)


import numpy as np
import matplotlib.pyplot as plt
from sklearn.neighbors import KNeighborsClassifier

# 한글 폰트 설정
plt.rc('font', family='Malgun Gothic')
plt.rcParams['axes.unicode_minus'] = False

# 색상(x1), 무게(x2)
x = np.array([
    [1,2],[2,3],[1,3],   # 사과
    [8,8],[9,7],[8,9]    # 바나나
])
y = np.array([0,0,0,1,1,1])   # 0=사과, 1=바나나
new_fruit = np.array([[2,2],[9,8]])  # 새 과일

# KNN 모델 생성 (이웃 1개)
model = KNeighborsClassifier(n_neighbors=1)
model.fit(x, y)  # 모델 학습
pred = model.predict(new_fruit)  # 예측
print(pred)

# 시각화
plt.scatter(x[y==0,0], x[y==0,1], color='r', label='사과')
plt.scatter(x[y==1,0], x[y==1,1], color='y', label='바나나')
plt.scatter(new_fruit[:,0], new_fruit[:,1], color='g', label='새과일', s=250, marker='*')
plt.legend()
plt.title('KNN 예제 - 과일 분류')
plt.xlabel('색상')
plt.ylabel('무게')
plt.show()

설명: K=1일 때 가장 가까운 과일의 종류를 기준으로 새 과일 분류.

핵심 포인트: KNN의 기본 작동 원리를 시각적으로 이해할 수 있는 기초 예제.


2. Ex02 – 학생 합격 예측


import numpy as np
from matplotlib import pyplot as plt
from sklearn.neighbors import KNeighborsClassifier

# 공부시간(x1), 수면시간(x2)
x = np.array([
    [2,9],[1,5],[3,7],
    [6,2],[7,3],[8,4]
])
y = np.array([0,0,0,1,1,1])   # 0=불합격, 1=합격
new_student = np.array([[4,6],[7,2]])  # 새 학생

# 모델 생성 및 학습
model = KNeighborsClassifier(n_neighbors=3)
model.fit(x, y)
pred = model.predict(new_student)
print('예측 결과:', pred)

# 거리 확인
distances, index = model.kneighbors(new_student)
print('거리:', distances)
print('이웃 인덱스:', index)

# 시각화
plt.scatter(x[y==0,0], x[y==0,1], color='red', label='불합격')
plt.scatter(x[y==1,0], x[y==1,1], color='blue', label='합격')
plt.scatter(new_student[:,0], new_student[:,1], color='green', marker='*', s=150, label='새학생')
plt.title('KNN - 학생 합격 예측')
plt.grid(True)
plt.legend()
plt.show()

설명: 가까운 학생들의 학습 패턴을 기준으로 새 학생의 합격 여부를 예측.

핵심 포인트: kneighbors()로 거리 기반 의사결정 과정을 직접 확인 가능.


3. Ex03 – 결정경계(Decision Boundary) 시각화


import numpy as np
from matplotlib import pyplot as plt
from sklearn.neighbors import KNeighborsClassifier

x = np.array([
    [1,2],[2,3],[2,2.5],[3,4],[4,5],  # 클래스 0
    [7,5],[8,8],[9,7]                 # 클래스 1
])
y = np.array([0,0,0,0,0,1,1,1])
new_point = np.array([[6,5]])   # 새 데이터
k_values = [1,3,5]

plt.figure(figsize=(15,5))
for i, k in enumerate(k_values):
    model = KNeighborsClassifier(n_neighbors=k)
    model.fit(x, y)
    pred = model.predict(new_point)

    # 평면 좌표(grid) 생성
    x_min, x_max = x[:,0].min(), x[:,0].max()+1
    y_min, y_max = x[:,1].min(), x[:,1].max()+1
    xx, yy = np.meshgrid(np.arange(x_min, x_max, 0.1),
                         np.arange(y_min, y_max, 0.1))
    xy = np.vstack((xx.ravel(), yy.ravel())).T
    z = model.predict(xy).reshape(xx.shape)

    # 시각화
    plt.subplot(1,3,i+1)
    plt.contourf(xx, yy, z, colors=['#FADADD','#D6EAF8'], alpha=0.7)
    plt.scatter(x[y==0,0], x[y==0,1], color='r', label='사과')
    plt.scatter(x[y==1,0], x[y==1,1], color='y', label='바나나')
    plt.scatter(new_point[:,0], new_point[:,1],
                color='g' if pred==1 else 'b',
                marker='X', s=120, label='새 데이터')
    plt.title(f'k = {k}')
    plt.legend()
plt.show()

설명: K값에 따라 분류 경계가 어떻게 달라지는지 시각화.

핵심 포인트: 결정경계를 통해 KNN의 지역적(Local) 분류 특성 이해.


4. Ex04 – 스팸 메일 분류


import numpy as np
from matplotlib import pyplot as plt
from sklearn.metrics import confusion_matrix, classification_report
from sklearn.model_selection import train_test_split
from sklearn.neighbors import KNeighborsClassifier

# 난수 데이터 생성
n = 100
normal = np.random.normal([1,1],[1.0,10],(n//2,2))
spam = np.random.normal([2.5,2.5],[1.0,10],(n//2,2))
x = np.vstack([normal, spam])
y = np.array([0]*(n//2) + [1]*(n//2))  # 0=정상, 1=스팸

# 학습/테스트 분리
x_train, x_test, y_train, y_test = train_test_split(x, y, test_size=0.2, random_state=42)

# 모델 학습 및 예측
model = KNeighborsClassifier(n_neighbors=5)
model.fit(x_train, y_train)
y_pred = model.predict(x_test)

# 평가
print(confusion_matrix(y_test, y_pred))
print(classification_report(y_test, y_pred))

# 새 데이터
new_emails = np.array([[1.2,0.8],[3.5,2.9],[2.0,2.0]])
pred_new = model.predict(new_emails)

# 시각화
plt.scatter(x_test[y_test==0,0], x_test[y_test==0,1], color='blue', label='정상')
plt.scatter(x_test[y_test==1,0], x_test[y_test==1,1], color='red', label='스팸')

# 새 이메일 표시
for i, p in enumerate(pred_new):
    plt.scatter(new_emails[i,0], new_emails[i,1], color='green' if p==0 else 'yellow', marker='*', s=200)

# 오분류 표시
error = (y_test != y_pred)
plt.scatter(x_test[error,0], x_test[error,1], edgecolors='k', facecolors='none', s=150, label='오분류')

plt.legend()
plt.title('KNN - 스팸메일 분류')
plt.show()

설명: 무작위 데이터를 이용해 정상/스팸 분류, 혼동행렬로 성능 평가.

핵심 포인트: KNN 분류 모델의 평가 방법 이해 (Precision, Recall, F1-score).


5. Ex05 – 이상 거래 탐지 


import numpy as np
from matplotlib import pyplot as plt
from sklearn.model_selection import train_test_split
from sklearn.neighbors import KNeighborsClassifier

# 데이터 생성 (시간, 금액)
n = 100
np.random.seed(11)
normal_transactions = np.random.normal([13.5, 10], [3.5, 3.5], (n//2, 2))
abnormal_transactions = np.random.normal([3.5, 20], [3.5, 3.5], (n//2, 2))
x = np.vstack((normal_transactions, abnormal_transactions))
y = np.array([0]*(n//2) + [1]*(n//2))

# 학습/테스트 분리
x_train, x_test, y_train, y_test = train_test_split(x, y, test_size=0.3, random_state=42)

# 모델 훈련
model = KNeighborsClassifier(n_neighbors=5)
model.fit(x_train, y_train)
y_pred = model.predict(x_test)

# 새 거래 예측
new_transactions = np.array([[14,8],[3,28],[9,18]])
y_pred2 = model.predict(new_transactions)
print('새 거래 예측 결과:', y_pred2)

# 시각화
plt.scatter(x_test[y_test==0,0], x_test[y_test==0,1], color='b', label='정상거래')
plt.scatter(x_test[y_test==1,0], x_test[y_test==1,1], color='r', label='이상거래')

# 오분류 표시
error = (y_test != y_pred)
plt.scatter(x_test[error,0], x_test[error,1], facecolors='none', edgecolors='k', s=100, label='오분류')

# 새 거래 표시
for i in range(len(y_pred2)):
    plt.scatter(new_transactions[i,0], new_transactions[i,1],
                color='g' if y_pred2[i]==0 else 'y',
                marker='*', s=150, edgecolors='k',
                label=f'새 거래 {i+1} ({"정상" if y_pred2[i]==0 else "이상"})')

plt.xlabel('거래 시각 (시)')
plt.ylabel('거래 금액 (만원)')
plt.title('KNN으로 본 신용카드 이상 거래 탐지')
plt.legend()
plt.grid(True)
plt.show()

설명: 거래 시간과 금액 데이터를 통해 이상 거래 탐지. 새 거래의 위치를 시각화로 표시하여 분류 결과 확인.

핵심 포인트: KNN을 이용한 Outlier Detection(이상치 탐지) 기본 구현 예시.


Ⅲ. 예제별 요약 정리

예제 주제 핵심 학습 포인트
Ex01 과일 분류 KNN 기본 개념 이해
Ex02 학생 합격 예측 거리 기반 분류 원리
Ex03 결정경계 시각화 K값 변화에 따른 경계 시각화
Ex04 스팸 메일 분류 혼동행렬 기반 모델 평가
Ex05 이상 거래 탐지 실제 데이터 응용

Ⅳ. 결론

KNN은 간단하지만 강력한 알고리즘으로, 데이터 간 거리 개념이 명확할수록 우수한 성능을 발휘합니다. 머신러닝 입문자에게는 직관적으로 작동 원리를 이해하기 좋은 대표적인 모델입니다.

1. Organization 생성하기

  1. GitHub 로그인 후 우측 상단 프로필 사진 클릭
  2. Your organizations 선택
  3. New organization 클릭
  4. 요금제 선택
    • Free: 기본적인 협업 가능
    • Team / Enterprise: 유료 기능(세부 권한, 보안 등)
  5. Organization 정보 입력
    • Organization name: 예) ai-challenge-team
    • Contact email: 관리자 이메일
  6. Create organization 클릭


2. 팀원 초대하기

  1. Organization 메인 페이지로 이동 (https://github.com/조직명)
  2. 상단 메뉴에서 People → Invite member 선택
  3. 팀원 GitHub ID 입력
  4. 역할(Role) 지정
    • Owner: 전체 관리 권한
    • Member: 일반 권한
  5. Send Invitation 클릭
  6. 초대 수락 시 자동 등록

3. Repository 생성

  1. Organization 페이지 → Repositories → New
  2. Repository 이름 입력 (예: ml-project)
  3. Owner가 Organization으로 설정되어 있는지 확인
    예) ai-challenge-team / ml-project
  4. 공개 범위 선택
    • Private: 내부 전용
    • Public: 공개용
  5. Create repository 클릭

4. 팀 및 권한 구조 설정

  1. Organization 페이지 → Teams → New team
  2. 팀 이름 작성 (backend, frontend, data-science 등)
  3. 권한(Role) 선택
    • Read: 읽기 전용
    • Triage: Issue/PR 관리 가능
    • Write: Push 가능
    • Maintain: 브랜치 관리 가능
    • Admin: 모든 권한
  4. 팀원 추가
  5. 각 팀을 Repository와 연결

5. 로컬 환경에서 연결

1. Repository 클론

git clone https://github.com/ai-challenge-team/ml-project.git


2. 브랜치 생성

git checkout -b feature/login


3. 작업 후 커밋 및 푸시

git add .
git commit -m "feat: 로그인 기능 추가"
git push origin feature/login

🌈 팀원

➡️아래 링크 게시글 3. 팀 협업 (팀 작업 절차 확인) 


2024.01.25 - [🟡개발 도구/Git] - Git 명령어


Git 명령어

🌈 목차Git 사용자 설정개인 저장소 업로드팀 협업 (팀원 작업 절차)Organizations에서 Fork 받기개인 작업 후 팀 저장소에 Push 하기팀원 파일 Pull 받기Git 명령어 정리 버전 관리 시스템 원하는 시점(

ryuding.tistory.com


1. SVM(Support Vector Machine) 

SVM(Support Vector Machine)은 데이터를 분류하는 경계선(결정경계) 을 찾는 지도학습 모델입니다.
핵심 아이디어는 두 클래스 간의 마진(Margin) 을 최대화하는 최적의 초평면(Hyperplane) 을 찾는 것


2. 순서

순서 파일명 내용
1 Ex02_SVM_결정경계_기초.py SVM 결정경계와 서포트 벡터의 기본 구조
2 Ex03_SVM_결정경계_수식.py 결정경계 수식 도출 및 마진 해석
3 Ex04_SVM_선형분류.py 선형(직선형) SVM 분류 실습
4 Ex05_SVM_비선형분류.py 비선형(곡선형) 분류 실습 — RBF 커널
5 Ex06_SVM_대출승인_비선형분류.py 실제 응용: 대출 승인 여부 예측


3. Ex02_SVM_결정경계_기초.py

: SVM의 결정경계(Decision Boundary) 와 서포트 벡터(Support Vector) 개념을 시각적으로 이해

import numpy as np
import matplotlib.pyplot as plt
from sklearn.svm import SVC

# 1. 데이터 생성
x_class1= np.array([[2,2],[3,3]])
x_class2= np.array([[-2,-2],[-3,-3]])

x = np.vstack((x_class1,x_class2))
y = np.array([0,0,1,1])

# 2. 선형 SVM 모델 생성 및 학습
model = SVC(kernel='linear')
model.fit(x, y)

# 학습된 파라미터 출력
print(f"model.coef_: {model.coef_}")
print(f"model.intercept_: {model.intercept_}")
print(f"model.support_vectors_:\n{model.support_vectors_}")

# 3. 시각화 설정
plt.rcParams['font.family'] = 'Malgun Gothic'
plt.rcParams['axes.unicode_minus'] = False
plt.scatter(x[:,0], x[:,1], cmap="coolwarm", c=y, edgecolors='k')
plt.scatter(model.support_vectors_[:,0], model.support_vectors_[:,1],
            s=200, edgecolors='k', facecolors='none', label="서포트 벡터")

# 4. 결정경계 계산용 그리드 생성
ax = plt.gca()
xlim = ax.get_xlim()
ylim = ax.get_ylim()
xx = np.linspace(xlim[0], xlim[1], 3)
yy = np.linspace(ylim[0], ylim[1], 3)
XX, YY = np.meshgrid(xx, yy)
xy = np.vstack([XX.ravel(), YY.ravel()]).T
z = model.decision_function(xy).reshape(XX.shape)

# 결정경계 등고선 표시
ax.contour(XX, YY, z, colors='black', linewidths=1, alpha=0.5,
           levels=[-1,0,1], linestyles=['--', '-', '-.'])
plt.legend()
plt.title("선형 SVM 결정경계와 서포트 벡터 시각화")
plt.show()

구분 설명

구분  설명
SVC(kernel='linear') 선형 커널 기반 SVM 모델 생성
model.fit(x, y) 학습 수행
decision_function() 각 점이 결정경계로부터 떨어진 거리 계산
contour() 등고선 형태로 결정경계 표시
support_vectors_ 결정경계를 형성하는 핵심 데이터 포인트


핵심 개념: SVM은 두 그룹을 나누는 “가장 넓은 간격(마진)”의 직선을 찾는다.


4. Ex03_SVM_결정경계_수식.py

: 결정경계 방정식과 마진을 직접 계산하여 시각화


import numpy as np
import matplotlib.pyplot as plt
from sklearn.svm import SVC

x_class1 = np.array([[2,2],[3,3]])
x_class2 = np.array([[-2,-2],[-3,-3]])
x = np.vstack((x_class1, x_class2))
y = np.array([0,0,1,1])

model = SVC(kernel='linear')
model.fit(x, y)

w = model.coef_[0]
b = model.intercept_[0]

x_vals = np.linspace(np.min(x[:,0]-1), np.max(x[:,0]), 100)
decision_boundary = -(w[0]*x_vals + b)/w[1]
margin_positive = -(w[0]*x_vals + b - 1)/w[1]
margin_negative = -(w[0]*x_vals + b + 1)/w[1]

plt.rcParams['font.family'] = 'Malgun Gothic'
plt.rcParams['axes.unicode_minus'] = False
plt.scatter(x[y==0, 0], x[y==0, 1], color='blue', label='클래스 0')
plt.scatter(x[y==1, 0], x[y==1, 1], color='red', label='클래스 1')
plt.plot(x_vals, decision_boundary, 'k-', label='결정경계')
plt.plot(x_vals, margin_positive, 'k-.', label='마진+1')
plt.plot(x_vals, margin_negative, 'k--', label='마진-1')
plt.legend()
plt.title('SVM 결정경계 수식 이해')
plt.show()

핵심 개념

개념  수식  설명
결정경계 w1x1 + w2x2 + b = 0 두 클래스를 나누는 기준선
마진 ±1 결정경계로부터 거리
서포트 벡터 마진에 닿는 점 모델 학습에 직접 영향

5. Ex04_SVM_선형분류.py

: 시험 점수(국어, 영어)를 이용한 합격/불합격 선형 분류 예제


# 시험점수 (국어, 영어) => 합격/불합격
import numpy as np
from matplotlib import pyplot as plt
from numpy.ma.extras import vstack
from sklearn.svm import SVC
from sklearn.model_selection import train_test_split

# 시험점수
np.random.seed(111)
# 합격
X_pass = np.random.randn(20, 2) *5 + [70,75]
print('X_pass:\n', X_pass)

# 불합격
X_fail = np.random.randn(20, 2) *5 + [50,55]
print('x_fail:\n', X_fail)

# 두 배열 합치기
x = vstack((X_pass, X_fail))
print('x:\n', x)

y = np.array([1]*20 + [0]*20)
print('y:\n', y)

# 학습/테스트용 나누기
x_train, x_test, y_train, y_test = train_test_split(x, y, test_size=0.3, random_state=111)

# SVC모델 학습
model = SVC(kernel='linear')
model.fit(x_train, y_train)

# x테스트의 y예측값
y_pred = model.predict(x_test)
print('y_pred:\n', y_pred)

# 결정경계 그리기
w = model.coef_[0]
b = model.intercept_[0]
x_vals = np.linspace(np.min(x[:,0]-1), np.max(x[:,0]), 100) # x축 설정

# 결정 경계
decision_boundary = -(w[0] * x_vals + b)/ w[1]
# 마진 + 1
margin_positive = -(w[0] * x_vals+ b-1) / w[1]
# 마진 - 1
margin_negative = -(w[0] * x_vals+ b+1) / w[1]

# 시각화
plt.rcParams['font.family'] = 'Malgun Gothic'
plt.rcParams['axes.unicode_minus'] = False

# x[y==0, 0] 불합격자의 국어 점수
# x[y==0, 1] 불합격자의 영어 점수
plt.scatter(x_train[y_train==0, 0], x_train[y_train==0, 1],color='blue', s=100, label='불합격')

# x[y==1, 0] 합격자의 국어 점수
# x[y==1, 1] 합격자의 영어 점수
plt.scatter(x_train[y_train==1, 0], x_train[y_train==1, 1],color='red', s=100, label='합격')
plt.plot(x_vals, decision_boundary,'k', label='결정경계', alpha=0.5, linewidth=5)
plt.plot(x_vals, margin_positive,'k--' ,label='마진+1',  alpha=0.5)
plt.plot(x_vals, margin_negative,'k-.' ,label='마진-1',  alpha=0.5)
plt.scatter(
    model.support_vectors_[:,0],
    model.support_vectors_[:,1],
    s=100,
    facecolors='none',
    edgecolors='black',
    label="서포트 벡터"
)

plt.legend()
plt.title('"SVM 선형분류: 결정경계 및 서포트 벡터 시각화"')
plt.show()

for x, y in zip(x_test, y_pred):
    result = '합격' if y else '불합격'
    print('시험 점수 {} -> 예측: {}'.format(x, result))

# for i, point in enumerate(x_test):
#     print(f"시험점수 {point} => 예측 : {'합격' if y_pred[i]==0 else '불합격'}")

print(f"y_test :{y_test}")
print(f"y_pred: {y_pred}")

# 정확도
from sklearn.metrics import accuracy_score
acc = accuracy_score(y_test, y_pred)
print("정확도:", acc)

# new data
x_new = np.array([[80,70],[60,65],[45,50],[72,78]])
x_new_pred = model.predict(x_new)
print("x_new_pred:\n", x_new_pred)

for x, y in zip(x_new, x_new_pred):
    result = '합격' if y else '불합격'
    print(f'시험 점수 {x} -> 예측: {result}')


설명

  • 커널 : linear
  • 목적 : 직선형 결정경계를 통해 점수 분류
  • 함수
    • train_test_split() : 학습/테스트 데이터 분할
    • accuracy_score() : 정확도 계산

6. Ex05_SVM_비선형분류.py

: 비선형(곡선형) 분류를 위한 RBF 커널 사용 예제

# 시험점수 (국어, 영어) => 합격/불합격
import numpy as np
from matplotlib import pyplot as plt
from numpy.ma.extras import vstack
from sklearn.svm import SVC
from sklearn.model_selection import train_test_split

# 시험점수
np.random.seed(111)
# 합격
X_pass = np.random.randn(20, 2) *5 + [70,75]

# 불합격
X_fail = np.random.randn(20, 2) *5 + [50,55]

# 두 배열 합치기
x = vstack((X_pass, X_fail))
y = np.array([1]*20 + [0]*20)

# 학습/테스트용 나누기
x_train, x_test, y_train, y_test = train_test_split(x, y, test_size=0.3, random_state=42)

# SVC모델 학습
model = SVC(kernel='rbf')
model.fit(x_train, y_train)
print(model.intercept_)

# 그래프
plt.rcParams['font.family'] = 'Malgun Gothic'
plt.rcParams['axes.unicode_minus'] = False
plt.figure(figsize=(8,6))
plt.scatter(x_train[y_train==1,0], x_train[y_train==1,1], color='blue', label='합격')
plt.scatter(x_train[y_train==0,0], x_train[y_train==0,1], color='red', label='불합격')

ax = plt.gca()
# x축 y축 크기
xlim = ax.get_xlim() # 41~79
ylim = ax.get_ylim() # 49~88

XX = np.linspace(xlim[0], xlim[1], num=100) #41,79
YY = np.linspace(ylim[0], ylim[1], num=100) #49,88
XX,YY = np.meshgrid(XX, YY)
print(XX.shape, YY.shape)

xy = vstack((XX.ravel(), YY.ravel())).T
print(xy.shape)

Z = model.decision_function(xy).reshape(XX.shape)
ax.contour(XX, YY, Z, colors='black', linewidths=2, alpha=0.5,levels=[-1,0,1],linestyles=['--', '-', '-.'])

plt.contourf(XX,YY,Z,levels=[Z.min(),0,Z.max()], colors=['#FFCCCC','#CCCCFF'],alpha=0.3)

plt.scatter(
    model.support_vectors_[:,0],
    model.support_vectors_[:,1],
    s=100,
    facecolors='none',
    edgecolors='black',
    label="서포트 벡터"
)

plt.title("SVM 비선형(곡선) 분류: 결정경계 및 서포트 벡터 시각화")
plt.legend()
plt.show()

pred = model.predict(x_test)
# 테스터데이터 예측
for x, y in zip(x_test, pred):
    result = '합격' if y else '불합격'
    print(f'시험 점수 {x} -> 예측: {result}')

설명

  • 커널 : rbf (Radial Basis Function)
  • decision_function() : 각 점이 경계로부터 떨어진 거리 계산
  • contourf() : 곡선형 결정경계 색상으로 표현

7. Ex06_SVM_대출승인_비선형분류.py

: RBF 커널을 이용한 실제 예제 — 대출 승인/거절 예측


import numpy as np
from matplotlib import pyplot as plt
from numpy.ma.extras import vstack
from sklearn.svm import SVC
from sklearn.model_selection import train_test_split

np.random.seed(111)
x_approved = np.random.randn(20, 2) * 5 + [70, 750]
x_denied = np.random.randn(20, 2) * 5 + [50, 600]
x = vstack((x_approved, x_denied))
y = np.array([1]*20 + [0]*20)

# 테스트데이터
x_train, x_test, y_train, y_test = train_test_split(x, y, test_size=0.2, random_state=42)

# 학습
model = SVC(kernel='rbf')
model.fit(x_train, y_train)

# 결정계수
plt.rcParams['font.family'] = 'Malgun Gothic'
plt.rcParams['axes.unicode_minus'] = False
plt.figure(figsize=(8,6))
plt.scatter(x_train[y_train==1,0], x_train[y_train==1,1], color='red', label='승인')
plt.scatter(x_train[y_train==0,0], x_train[y_train==0,1], color='blue', label='거절')

ax = plt.gca()
xlim = ax.get_xlim()
ylim = ax.get_ylim()

XX = np.linspace(xlim[0], xlim[1], num=100)
YY = np.linspace(ylim[0], ylim[1], num=100)
XX, YY = np.meshgrid(XX, YY)
xy = vstack([XX.ravel(), YY.ravel()]).T
Z = model.decision_function(xy).reshape(XX.shape)

ax.contour(XX, YY, Z, colors='black', linewidths=2, alpha=0.5,levels=[-1,0,1],linestyles=['--', '-', '-.'])
plt.scatter(model.support_vectors_[:,0], model.support_vectors_[:,1],s=100, facecolor='none',edgecolors='black' )
plt.contourf(XX,YY,Z,levels=[Z.min(),0,Z.max()], colors=['#FADADD', '#D6EAF8'],alpha=0.3)
plt.legend()
plt.show()

# 예측
pred = model.predict(x_test)
print(pred)
for x,y in zip(x_test,pred):
    result = '대출 가능' if y else '대출 불가능'
    print(f'급여, 신용점수 {x} -> 예측: {result}')


설명

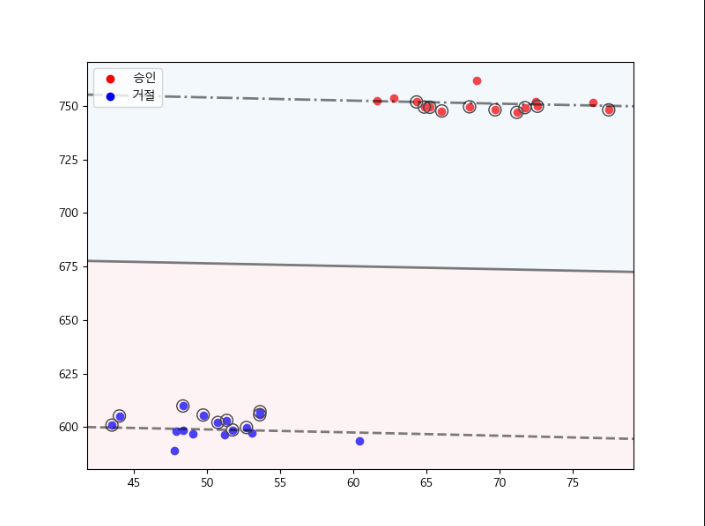
  • 입력: (급여, 신용점수)
  • 출력: 대출 가능(1), 불가능(0)
  • 모델: RBF 커널 기반 SVM
  • 결과: 경계선을 따라 승인/거절 구역이 곡선 형태로 분리됨

9. 주요 함수 요약

함수  역할
SVC() SVM 모델 생성
fit() 모델 학습
predict() 예측 수행
decision_function() 각 점의 경계 거리 계산
contour() 결정경계 시각화
contourf() 분류 영역 시각화
train_test_split() 데이터 분리
accuracy_score() 정확도 계산

10. 학습 포인트 요약

  1. 선형 SVM 은 직선(또는 초평면)으로 데이터를 나눈다.
  2. 비선형 SVM (RBF 커널) 은 곡선 형태의 결정경계를 형성한다.
  3. 서포트 벡터 는 모델의 결정경계를 결정짓는 핵심 포인트다.
  4. 결정함수 값이 0인 지점이 바로 결정경계이다.

1. 표준화(Standardization)란?

데이터 분석이나 머신러닝에서 변수의 단위가 다를 때(예: cm, kg 등)
모델이 특정 변수에 과도하게 영향을 받지 않도록 데이터를 일정한 기준으로 맞추는 과정을 말합니다.

표준화는 각 변수의 데이터를 평균 0, 표준편차 1로 변환합니다.

수식으로는 다음과 같습니다.


  • μ 평균(mean)
  • σ: 표준편차(standard deviation

2. (분류)Ex01 - 코드 예제

import pandas as pd
from sklearn.preprocessing import StandardScaler

# 1) 예시 데이터 생성
data = {
    'height' : [160,165,170,175,180],
    'weight' : [55,60,65,70,75]
}

df = pd.DataFrame(data)
print(df)

# 2) StandardScaler 객체 생성
scaler = StandardScaler()

# 3) 표준화 학습 (fit)
scaler.fit(df)

# 4) 표준화 변환 (transform)
x_scale = scaler.transform(df) # 방법 1: fit → transform
x2_scaler = scaler.fit_transform(df) # 방법 2: fit_transform 한 번에 수행

# 5) 결과 출력
print(scaler.mean_)   # 각 변수의 평균
print(scaler.scale_)  # 각 변수의 모표준편차(모집단 표준편차)

print(df.mean())                       # 원본 평균
print("모표준편차 : ", df.std(ddof=0)) # 모집단 표준편차
print("표본 표준편차 : ", df.std(ddof=1)) # 표본 표준편차

print(f"표준화 평균 : {x_scale.mean()}")
print(f"표준화 표준편차1 : {x_scale.std()}")
print(f"표준화 표준편차2 : {x_scale.std(ddof=0)}")
print(f"표준화 표준편차3 : {x_scale.std(ddof=1)}")


3. 실행 결과 예시

   height  weight
0     160      55
1     165      60
2     170      65
3     175      70
4     180      75

scaler.mean_ : [170.  65.]
scaler.scale_ : [7.07106781 7.07106781]

원본 평균
height    170.0
weight     65.0
dtype: float64

모표준편차 : 
height    7.071068
weight    7.071068
dtype: float64

표본 표준편차 : 
height    7.905694
weight    7.905694
dtype: float64

표준화 평균 : 0.0
표준화 표준편차1 : 1.0
표준화 표준편차2 : 1.0
표준화 표준편차3 : 1.118033988749895


4. 주요 개념 정리

구분  설명   
평균(mean) 각 열의 평균값 scaler.mean_, df.mean()
모표준편차(σ) 모집단 기준 표준편차 (ddof=0) scaler.scale_, df.std(ddof=0)
표본표준편차(s) 표본 기준 표준편차 (ddof=1) df.std(ddof=1)
표준화 결과 평균이 0, 표준편차가 1로 변환된 데이터 x_scale

5. fit, transform, fit_transform 차이

메서드  설명
fit() 데이터의 평균과 표준편차를 계산하여 저장
transform() 저장된 평균과 표준편차로 실제 변환 수행
fit_transform() 두 과정을 한 번에 수행


6. 정리

  • 표준화는 머신러닝에서 매우 중요한 전처리 과정입니다.
  • 평균 0, 표준편차 1로 맞추어 모델이 특정 변수에 치우치지 않도록 만듭니다.
  • StandardScaler는 모집단 표준편차(ddof=0) 를 기준으로 계산합니다.
  • 변환된 데이터는 항상 평균이 0, 표준편차가 1에 가깝게 됩니다.

1. 다중회귀란?

다중회귀(Multiple Linear Regression) 는 두 개 이상의 독립변수(X₁, X₂, …)를 사용해
하나의 종속변수(Y)를 예측하는 회귀모델이다.


일반식

y=w1x1+w2x2++b

  • wi: 각 독립변수의 기울기(회귀계수, weight)
  • : 절편(intercept)
  • : 종속변수(예측 대상)

2. Ex06 ― 두 개의 변수로 예측하기

from sklearn.linear_model import LinearRegression
import numpy as np

x = np.array([
    [0, 1],
    [5, 1],
    [15, 2],
    [25, 5],
    [35, 11],
    [45, 15],
    [55, 34],
    [60, 35]
])
y = np.array([4, 5, 20, 14, 32, 22, 38, 43])

model = LinearRegression()
model.fit(x, y)


print("기울기:", model.coef_)      # 각 독립변수의 가중치
print("절편:", model.intercept_)


회귀식

y=w1​x1​+w2​x2​+b


결정계수(R²) 계산

: 모델의 설명력을 나타내는 지표로,
1에 가까울수록 데이터의 변동을 잘 설명한다

from sklearn.metrics import r2_score

# 직접 계산
RSS = np.sum((y - model.predict(x)) ** 2)   # 오차제곱합
TSS = np.sum((y - np.mean(y)) ** 2)         # 전체변동합
R2_manual = 1 - (RSS / TSS)

# 함수 사용
R2 = r2_score(y, model.predict(x))
print("결정계수(R²):", R2)


새로운 데이터 예측

x_test = np.array([[6,5],[8,6],[5,7]])
pred = model.predict(x_test)
print("예측 결과:", pred)

3. Ex07_MSE_RMSE ― 회귀모델의 성능 평가 지표

data = {
    'study_time': [2, 3, 4, 5, 6, 8, 10, 12],
    'sleep_time': [9, 8, 8, 7, 6, 6, 5, 5],
    'phone_time': [5, 5, 4, 4, 3, 2, 2, 1],
    'score': [50, 55, 60, 65, 70, 75, 85, 88]
}


  • 독립변수(X): 공부시간, 수면시간, 휴대폰 사용시간
  • 종속변수(y): 시험 점수

모델 학습

df = pd.DataFrame(data)
x = df.drop('score', axis=1)
y = df['score']

model = LinearRegression()
model.fit(x, y)


회귀계수 및 절편

print("기울기:", model.coef_)
print("절편:", model.intercept_)


모델 평가: R², MSE, RMSE

from sklearn.metrics import mean_squared_error, r2_score
y_pred = model.predict(x)

# 결정계수 R²
r2 = r2_score(y, y_pred)

# 평균제곱오차 (MSE)
MSE = mean_squared_error(y, y_pred)

# 제곱근평균제곱오차 (RMSE)
RMSE = np.sqrt(MSE)


지표  의미  값이 클수록 / 작을수록
설명력 (모델이 데이터를 얼마나 잘 설명하는가) 클수록 좋음
MSE 예측오차 제곱의 평균 작을수록 좋음
RMSE 제곱근 취한 오차 평균 (원래 단위) 작을수록 좋음


예측 테스트

x_test = pd.DataFrame(
    [[6,7,2],[4,8,4],[10,5,1]],
    columns=['study_time', 'sleep_time', 'phone_time']
)
print(model.predict(x_test))

4. Ex08.py ― 실제 부동산 데이터에 적용하기

데이터 전처리

df = pd.read_csv("서울시 부동산 실거래가 정보.csv", encoding="UTF-8")
df = df.dropna()
x = df[['건물면적(㎡)', '층', '건축년도']]
y = df['물건금액(만원)']


학습 및 예측

from sklearn.model_selection import train_test_split
x_train, x_test, y_train, y_test = train_test_split(x, y, test_size=0.2, random_state=42)

model = LinearRegression()
model.fit(x_train, y_train)


회귀식 출력

coef = model.coef_
intercept = model.intercept_
print(f"회귀식: y = {coef[0]:.2f}*건물면적 + {coef[1]:.2f}*층 + {coef[2]:.4f}*건축년도 + ({intercept:.2f})")


결정계수 비교

from sklearn.metrics import r2_score
train_R2 = r2_score(y_train, model.predict(x_train))
test_R2 = model.score(x_test, y_test)
print(f"train_R2 : {train_R2}")
print(f"test_R2 : {test_R2}")


예측 예시

arr = pd.DataFrame([[84, 5, 2010]], columns=['건물면적(㎡)', '층', '건축년도'])
pred_arr = model.predict(arr)
print(f"예상 가격: {pred_arr[0]:.2f} 만원")


5. 요약

결정계수 모델의 설명력 1에 가까울수록 좋음
MSE 평균제곱오차 예측오차의 제곱평균 작을수록 정확
RMSE 제곱근평균제곱오차 실제 단위로 환산된 오차 작을수록 성능 좋음
coef_ 회귀계수 변수의 영향력 +면 양의 상관, -면 음의 상관

6. 정리 포인트

  • 단일회귀 → 다중회귀로 확장 시 변수 간 상호작용을 더 잘 설명할 수 있다.
  • 오차(MSE, RMSE)는 모델의 예측 성능 평가의 핵심 지표이다.
  • 실제 데이터 적용 시 결측치 처리(dropna)와 데이터 전처리가 중요하다.
  • 결정계수(R²)는 높을수록 모델이 데이터를 잘 설명한다.

1. 선형회귀 기본 개념

선형회귀(Linear Regression)
입력 변수 x와 출력 변수 y의 관계를 직선(line) 으로 근사하는 통계적 방법


y=ax+b


항목 의미
a 기울기 (slope, 회귀계수)
b 절편 (intercept, y절편)
y 예측값 (predicted value)


2. Ex03 - 단순선형회귀 코드 예제

from sklearn.linear_model import LinearRegression
from matplotlib import pyplot as plt
import numpy as np
plt.rcParams['font.family'] = 'Malgun Gothic'
plt.rcParams['axes.unicode_minus'] = False

# 학습용 데이터
x = np.array([50, 60, 70, 80, 90, 100, 110])
y = np.array([150, 180, 200, 220, 240, 260, 300])

model = LinearRegression()
X = x.reshape(-1, 1)
model.fit(X, y)

# 기울기와 절편 출력
coef = model.coef_[0]
intercept = model.intercept_
print(f"기울기 :{coef}\n절편 : {intercept}")

# y예측값
y_pred = model.predict(X)
print(f"y예측값(y_pred):\n{y_pred}")

# 결정계수
from sklearn.metrics import r2_score
r2 = r2_score(y, y_pred)
print(f"결정계수(r2) : {r2_score(y, y_pred)}")

RSS = np.sum((y - y_pred) ** 2) # 실제값 - 예측값
TSS = np.sum((y - np.mean(y)) ** 2) # 실제값 - 평균값
R2 = 1 - (RSS / TSS)
print(f"R² : {R2:.4f}")


# 그래프 시각화
plt.scatter(x, y, label="실제 데이터")
plt.grid(True, linestyle='--', alpha=0.6)
plt.plot(x, y_pred, color='red', alpha=0.5,  label=f"회귀선: y = {coef:.2f}x + {intercept:.2f}\nR2={r2:.3f}")
plt.xlabel("집 크기")
plt.ylabel("집 가격")
plt.legend()
plt.show()

테스트 데이터 예측

: 새로운 입력 값(집 크기)을 넣어 예측

# 새로운 테스트 데이터
arr = np.array([55, 75, 95, 105]).reshape(-1, 1)
pred = model.predict(arr)

# 예측 결과 출력
for i in range(len(arr)):
    print(f"{arr[i][0]}㎡ → 예측 가격: {pred[i]:.2f}만원")
출력 예시
55㎡ → 예측 가격: 165.71만원
75㎡ → 예측 가격: 191.86만원
95㎡ → 예측 가격: 218.00만원
105㎡ → 예측 가격: 231.57만원


3. Ex05 - 훈련 데이터와 테스트 데이터로 선형회귀 성능 평가 (train_test_split)

선형회귀(Linear Regression) 는 데이터를 기반으로
입력(x)과 출력(y) 사이의 선형 관계를 찾아내는 모델이다.

하지만 모든 데이터를 학습에 사용하면 과적합(Overfitting) 위험이 있다.
→ 따라서 데이터를 훈련용(Train)테스트용(Test) 으로 분리하여 모델의 일반화 능력을 확인


데이터 구분 설명
훈련 데이터 (train) 모델 학습에 사용
테스트 데이터 (test) 학습 후 성능 검증에 사용


전체 코드

from sklearn.linear_model import LinearRegression
from sklearn.model_selection import train_test_split
from sklearn.metrics import r2_score
import numpy as np
import matplotlib.pyplot as plt

plt.rcParams['font.family'] = 'Malgun Gothic'
plt.rcParams['axes.unicode_minus'] = False

# 1) 데이터 준비
x = np.array([50, 60, 70, 80, 90, 100, 110])
y = np.array([150, 180, 200, 220, 240, 260, 300])

# sklearn은 입력값을 2차원 형태로 받아야 함
x = x.reshape(-1, 1)

# 2) 데이터 분리 (훈련 70%, 테스트 30%)
x_train, x_test, y_train, y_test = train_test_split(
    x, y, test_size=0.3, random_state=42
)

# 3) 모델 생성 및 학습
model = LinearRegression()
model.fit(x_train, y_train)

# 4) 기울기와 절편 출력
coef = model.coef_[0]       # 기울기
intercept = model.intercept_ # 절편
print(f"기울기 : {coef}")
print(f"절편 : {intercept}")

# 5) 테스트 데이터 예측
y_test_pred = model.predict(x_test)

# 6) 결정계수 (R²)
r2_test = r2_score(y_test, y_test_pred)
print(f"테스트데이터 결정계수(R²) : {r2_test:.4f}")

# 7) 시각화
plt.scatter(x_train, y_train, color='blue', label='훈련 데이터')
plt.scatter(x_test, y_test, color='orange', label='테스트 데이터')
plt.plot(x, model.predict(x), color='red',
         label=f"회귀선 (R²={r2_test:.3f})")

plt.title('선형 회귀 : 훈련/테스트 데이터 비교')
plt.xlabel('집 크기')
plt.ylabel('집 가격')
plt.legend()
plt.grid(True, linestyle='--', alpha=0.6)
plt.show()

결과 해석


항목  의미
기울기(a) x가 1 증가할 때 y가 약 2.51 증가
절편(b) x=0일 때 예측된 y값 (약 20)
결정계수(R²) 모델이 테스트 데이터의 변동을 약 99.7% 설명


시각화 설명


  • 파란색 점: 훈련 데이터 (train)
  • 주황색 점: 테스트 데이터 (test)
  • 빨간선: 학습된 회귀선


4. 결정계수(R²)란?

결정계수(R²)는 모델의 설명력을 나타내는 지표로,
1에 가까울수록 실제값과 예측값이 잘 일치함을 의미


R2 = 1TSS / RSS


기호  의미
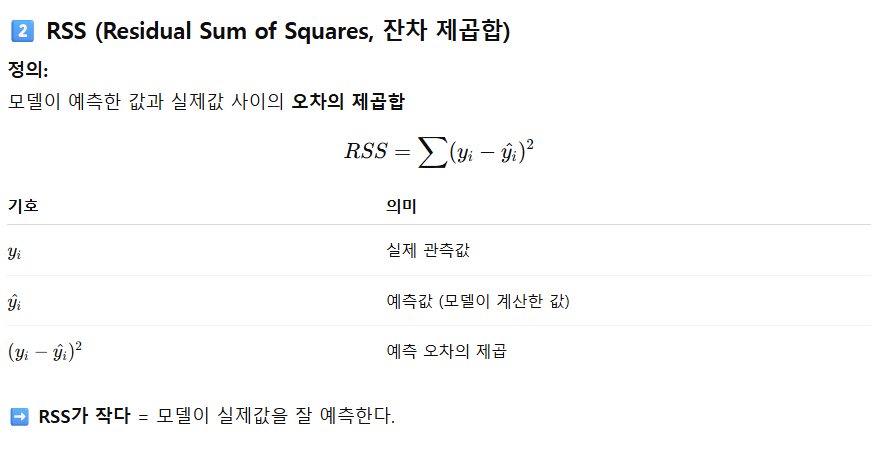
RSS (Residual Sum of Squares) 잔차 제곱합 — 예측오차
TSS (Total Sum of Squares) 전체 제곱합 — 데이터 전체 변동성
설명력 (0~1 사이 값)


🔽TSS와 RSS (접은글)

더보기

1) TSS (Total Sum of Squares, 전체 제곱합)


2) RSS (Residual Sum of Squares, 잔차 제곱합)


5. 핵심 포인트 정리

  • train_test_split()으로 데이터를 나누어 일반화 성능 확인
  • r2_score()는 예측 정확도를 수치로 평가 (1에 가까울수록 좋음)
  • LinearRegression().fit(X, y) → 학습
  • model.predict() → 예측
  • 훈련데이터 R²테스트데이터 R²를 비교해 과적합 여부 판단

+ Recent posts